How industry IOT can save companies on huge costs by finding bottlenecks and make their process more visible
How industry IOT can save companies on huge costs by finding bottlenecks and make their process more visible
A production line can look busy while still losing time, output, material, and energy. A machine may run below its expected speed, a repeated micro-stop may go unrecorded, or one process may keep the rest of the line waiting.
When this information is collected manually, managers often see the result only after a shift has ended. The total output is known, but the sequence of events that reduced it is not.
Industrial IoT (IIoT) makes the process visible by collecting machine and PLC data continuously. It turns machine states, production counts, cycle times, faults, and quality signals into a live view of how production is actually performing.
That visibility helps teams find bottlenecks, focus improvement work on the losses with the greatest production impact, and avoid costs that remain hidden in manual reports.
Why Hidden Bottlenecks Become Expensive
A bottleneck is the part of a process that limits the output of the wider production flow. It is not always the machine with the longest single breakdown.
The real constraint may be:
- A machine that repeatedly stops for a few minutes
- A process running with an increasing cycle time
- A material-feeding problem that slows the next operation
- A changeover that takes longer on one shift
- A quality issue that creates rework or scrap
- A downstream machine that causes upstream equipment to wait
These losses create costs in several forms:
- Lost production time
- Lower throughput
- Overtime needed to recover a production plan
- Scrap and rework
- Unplanned maintenance activity
- Excess energy used during idle or inefficient operation
- Time spent preparing and reconciling manual reports
Without reliable event data, teams may respond to the most visible problem rather than the one with the greatest effect on output.
How Industrial IoT Makes Production More Visible
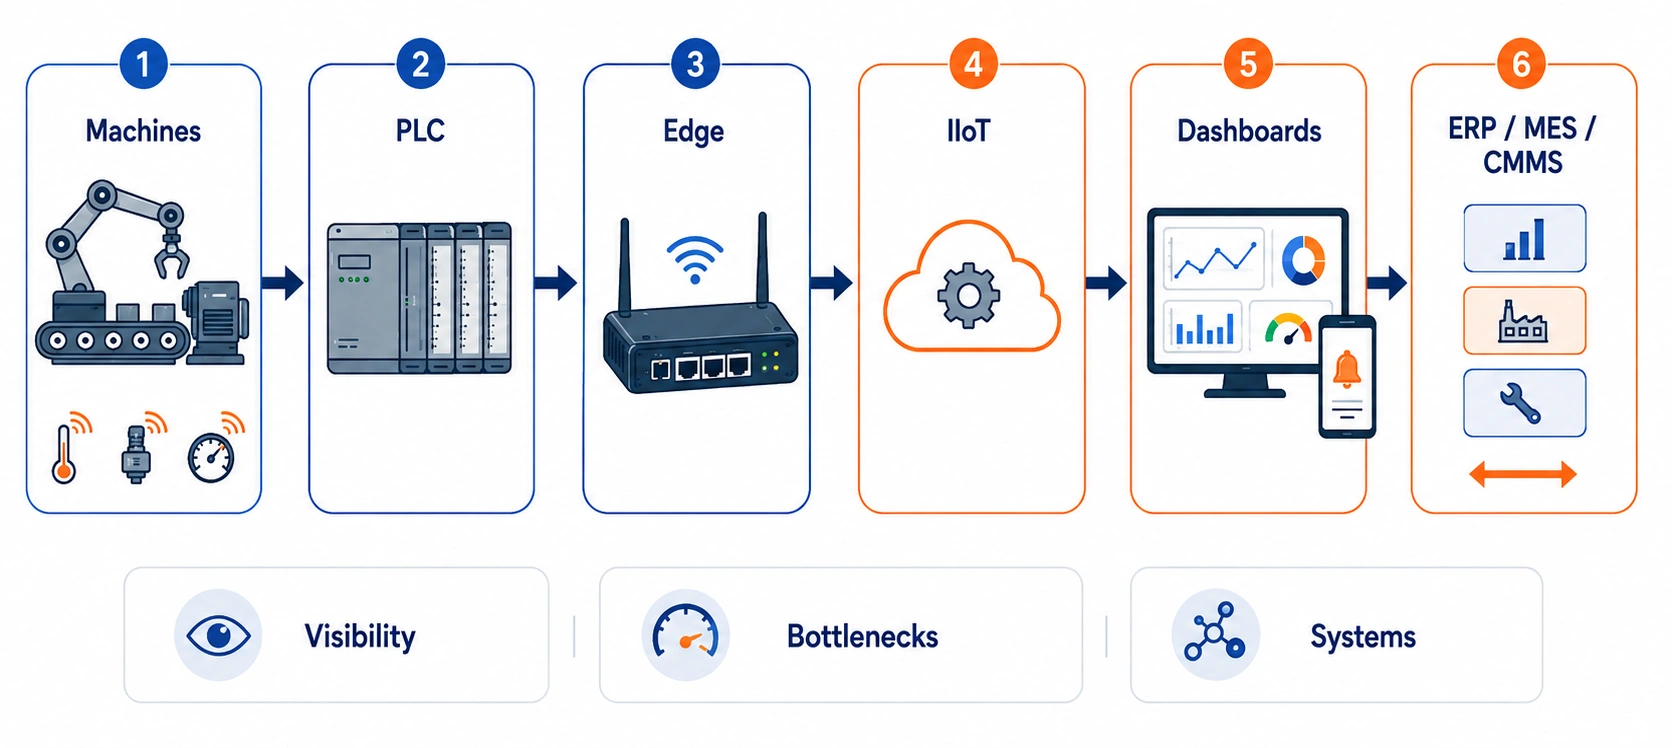
An IIoT system connects machines, PLCs, sensors, and production systems to a common data layer. Depending on the equipment, the connection may use an industrial edge gateway, OPC UA, Modbus, MQTT, an industrial PLC protocol, or an API.
A typical information flow is:
Machines / Sensors
        ↓
PLC / Controller
        ↓
Industrial Edge Gateway
        ↓
IIoT Data Processing
        ↓
Dashboards / Alerts / Analytics
        ↓
ERP / MES / CMMS
The objective is not simply to collect more data. It is to add production context so people can understand what the data means.
A raw PLC signal such as:
MachineRun = 0can become a useful production event:
Machine: Packaging Line 03
Status: Stopped
Start: 14:21:07
Duration: 4m 32s
Product: Product A
Shift: Shift 2
Reason: Material Feed Fault
Once machine events have timestamps and context, they can be compared across products, shifts, machines, production lines, and time periods.
What Data Helps Reveal a Bottleneck?
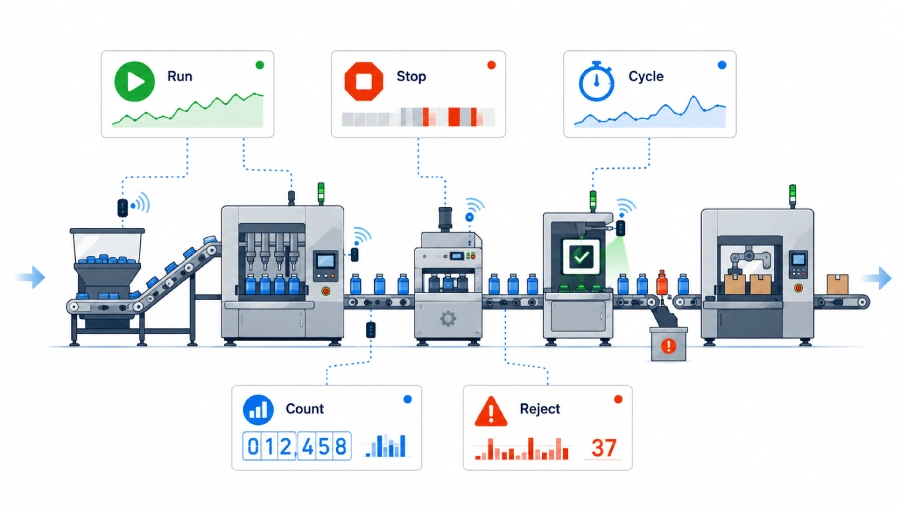
Finding a bottleneck does not always require hundreds of PLC tags. A focused set of production signals can provide a useful starting point.
| Machine or Production Data | What It Can Reveal |
|---|---|
| Running and stopped state | Uptime, downtime, and waiting time |
| Production counter | Actual throughput |
| Cycle time | Slow cycles and performance loss |
| Machine speed | Operation below the expected rate |
| Fault code | Repeated equipment-related losses |
| Good and reject counts | Quality loss, scrap, and rework |
| Product or recipe ID | Performance by product or job |
| Production order | Actual progress against the plan |
ERP, MES, CMMS, or production-planning data can add the product, order, planned quantity, maintenance, and schedule context that PLC data alone may not contain.
From Machine Signals to a Bottleneck Timeline
A live machine-state timeline shows when each part of a line is running, stopped, faulted, or waiting.
For example:
08:00  Line starts
09:14  Filler stops
09:15  Packaging begins waiting
09:22  Filler restarts
11:06  Packaging stops: material feed fault
11:19  Packaging restarts
One event may appear minor. Repeated across a shift, similar events can become a meaningful production loss.
Continuous collection is especially useful for micro-stops. Operators may not record every short interruption in a shift report, while an automated system can timestamp and aggregate each one.
The resulting analysis can answer questions such as:
- Which machine most often causes the line to wait?
- Which fault consumes the most production time?
- Which product has the longest actual cycle time?
- Does the bottleneck change between shifts or recipes?
- Is a machine stopped because of its own fault or because another process is blocked?
Use Cycle Time to See Performance Bottlenecks
A machine can be in a running state without producing at its expected rate. This makes cycle-time and production-count data important alongside simple uptime.
An IIoT platform can compare actual cycle time with the expected cycle time:
Expected Cycle Time: 1.2 seconds
Current Cycle Time:  1.5 seconds
The difference may point to reduced speed, minor stops, material-feeding issues, operator delays, or process instability.
Tracking the change over time is more useful than seeing only the final shift quantity. Teams can identify when performance began to decline and inspect the events around it.
Connect Bottleneck Analysis With OEE
Overall Equipment Effectiveness (OEE) combines three dimensions:
- Availability — whether the machine runs during planned production time
- Performance — whether it operates at the expected production speed
- Quality — how much of its production is good product
OEE = Availability × Performance × QualityThe OEE percentage is a useful summary, but the underlying losses show where action is needed.
Availability: 87.5%
Performance:  85.7%
Quality:      97.5%
In this view, performance and availability deserve more investigation than quality. Downtime events, cycle-time trends, fault codes, and production counts can then show which bottleneck is reducing those components.
This turns OEE from an end-of-shift score into a continuous-improvement tool.
Prioritize Losses by Their Production Impact
Once downtime is classified, teams can aggregate it into a Pareto view:
Mechanical Failure
Material Shortage
Changeover
Micro-Stops
Operator Waiting
Quality Adjustment
The purpose is to rank losses using evidence rather than assumptions. The first improvement project should not automatically target the newest machine, the loudest alarm, or the longest individual event. It should target the recurring loss with the most important effect on the production objective.
Teams can review the same information by machine, shift, product, fault, or time period to understand whether a constraint is persistent or changes with production conditions.
How Visibility Helps Control Cost
Industrial IoT supports cost control by making the operational causes of loss measurable.
Reduce Unplanned Downtime
Automatic machine-state collection records when downtime starts, how long it lasts, and how often it repeats. Maintenance and production teams can focus on recurring faults instead of relying only on end-of-shift recollection.
Recover Production Capacity
Removing a constraint can improve the flow of the wider line. Cycle-time, waiting-time, and throughput data help distinguish a true line constraint from an isolated machine event.
Reduce Scrap and Rework
Good and reject counts can be associated with the machine, product, batch, shift, and production order. Teams can investigate where and when quality losses occur rather than relying on a factory-wide percentage.
Improve Maintenance Decisions
Repeated faults and changes in operating behavior can support inspection and maintenance workflows. When connected with a CMMS, machine events can add evidence to maintenance notifications and recurring-failure analysis.
Reduce Manual Reporting
Automated production counts, downtime events, and shift summaries reduce dependence on spreadsheets and handwritten reports. The same data can feed dashboards and historical analysis without being entered again.
See Energy in Production Context
Energy monitoring becomes more actionable when consumption is compared with machine state, product, and production output. This can reveal energy used while equipment is idle or operating inefficiently.
Real-Time Visibility Changes the Response
An end-of-shift report may say:
Output was below plan.A real-time production view can show:
Current Machine State: STOPPED
Stop Duration: 11m 42s
Top Loss Today: Material Feeding
Current Cycle Time: Above Target
Production Order: Behind Plan
Historical reporting explains what happened. Real-time monitoring gives production teams an opportunity to respond while the loss is still happening.
Alerts can also draw attention to defined conditions such as a long stop, repeated fault, slow cycle, or production count falling behind the plan.
Can Legacy Machines Be Included?
Yes. The connection method depends on the machine and its control architecture.
Modern PLC-controlled equipment may already expose useful production data through an industrial communication interface. Older machines may require:
- An industrial IoT gateway
- Additional sensors
- Digital signal acquisition
- Counter inputs
- Current or power monitoring
- Retrofit connectivity
The objective is often to make existing equipment measurable, not replace it. Manufacturers can begin with one critical machine or line and expand after validating the data and the operational value.
A Practical Bottleneck-Visibility Pilot
A focused implementation can follow four stages.
1. Choose a Critical Process
Select a machine or line where downtime, slow cycles, waiting, or output loss is already an operational concern.
2. Map the Required Data
Identify the available machine states, production counters, cycle times, rejects, faults, and product information. Add production-order or maintenance context where it is needed.
3. Connect and Validate
Collect the data through the appropriate industrial interface. Confirm that the digital events match actual machine behavior before using them for decisions.
4. Build the Operational View
Create the dashboards, timelines, loss categories, alerts, and reports that answer the team's production questions. Review whether the data identifies a repeatable constraint and supports a measurable improvement process.
A pilot on one critical asset limits the initial scope and validates the approach before monitoring is expanded to other machines or facilities.
Frequently Asked Questions
Does Industrial IoT require replacing existing machines?
No. Existing PLC-controlled and legacy machines can often be connected through their available industrial interfaces, gateways, retrofit sensors, or additional data-acquisition hardware.
Is machine uptime enough to find a bottleneck?
Not always. Uptime should be considered with cycle time, production count, waiting state, faults, quality, product, and production-plan context. A machine may be running but producing below its expected rate.
Can bottleneck data connect with ERP or CMMS software?
Yes. ERP or MES data can add order, product, planned quantity, and schedule context. CMMS integration can connect machine events with inspection and maintenance workflows.
How quickly can production data be updated?
With automated PLC and IIoT collection, machine-state, count, cycle, fault, and quality events can be processed continuously as they arrive.
Should every machine be connected at once?
Not necessarily. Starting with one critical machine or line allows the team to validate signals, dashboards, and improvement workflows before scaling.
Make the Production Process Visible With Effecsa
Effecsa connects existing machines, PLCs, sensors, and enterprise systems to provide real-time production visibility.
The platform helps manufacturers:
- Monitor machine states and production in real time
- Detect downtime and repeated micro-stops
- Compare actual and expected cycle times
- Find bottlenecks across machines and production lines
- Track OEE, quality, scrap, and production KPIs
- Analyze losses by machine, shift, product, or fault
- Monitor energy use in production context
- Connect factory data with ERP and CMMS systems
- Scale from one pilot line to multiple facilities
By turning raw machine signals into production events and operational context, manufacturers can see where time, capacity, material, and energy are being lost—and focus improvement work where it matters most.